Closing the Gap
What We Learned About One Brand’s Experience with the Retail Apocalypse Using Web and Geo-Location Signals
The Retail Apocalypse
Today is an especially turbulent time for the retail industry. The past two years have seen retail brands across all verticals announce nearly 10,000 store closures. This trend has affected brands of all categories, from formerly stalwart general retailers such as JC Penney and Sears to fading apparel icons of the past like Ralph Lauren and J. Crew. The rise of e-commerce and decline of malls are a few macro-level trends often cited to explain the rapid increase in retail store closures. This phenomenon, commonly referred to as the “Retail Apocalypse”, has left retail industry veterans and curious onlookers alike wondering why stores across the board have struggled to command the foot traffic they once enjoyed in abundance.
Count us among the curious onlookers. With a data set of over 300 million user profiles and 3 million points of interest at our disposal, we are constantly exploring the ways people and brands interact in the physical world. We have worked in this space before, having published findings on the relationship between fitness centers and the distance gym-goers travel from their homes to visit. When we decided to analyze the Retail Apocalypse phenomenon, we sought to apply a similar focus on the interplay between retail locations and the visitors in their surrounding area. As we contemplated the dynamics behind the Retail Apocalypse, we boiled our inquiry down to a simple question we thought our data could help answer: Why did some of a brand’s locations close while others remained open?
The Experiment
We designed an experiment in which we attempted to predict a brand’s store closures based on attributes we knew about the areas surrounding a brand’s open stores. In the process, we hoped to learn what characterized closed stores compared to stores that remained open. We considered many of the brands who have been hit hard by the Retail Apocalypse and ultimately chose to study Gap based on two factors: availability of location data and geographic distribution. The retail brand known for its classic denim had closed a significant number of locations in the year prior, which provided us a wealth of data for our analysis. Additionally, the closed locations were distributed across the country, which helped reduce geographic bias in our analysis.
An initial investigation led us to two theories on the drivers of Gap store closures. The first theory centered on the household income of the areas surrounding Gap stores. We wondered if there was a relationship between a location’s likelihood to close and the household income of the area surrounding it. And if so, how strong a relationship? The second theory focused on web browsing and geo-behavioral patterns of the areas surrounding Gap stores. When looking at areas in which a Gap closed vs. areas in which Gap remains open, is there a significant difference in the type of content people browse online and the places people visit in the physical world? If so, what browsing patterns (online and physical) are characteristic of areas where a store has closed, and what can they tell us about why the brand did not succeed in those areas?
The Methodology
To test these theories on Gap store closure, we employed a predictive modeling approach. A predictive model attempts to forecast an outcome based on qualities it has associated with previous outcomes. The model we utilized to test our store closure theories was initially developed for the purposes of online advertising. It was constructed to predict the likelihood of a user making a purchase on a site, based on the web browsing behaviors of others who had purchased on that site. The higher the likelihood of someone making a purchase, the better candidate they were for an online advertisement. We repurposed this same model to predict if a Gap store would close, based on either the household income of the surrounding area, or the web browsing and location visitation patterns of the surrounding area.
The Results
We found that the model that considered the web browsing and geo-behavioral characteristics of the areas surrounding Gap stores performed 45% better than the model that only considered the household income of the surrounding Gap store area. In fact, the income-based model performed only slightly better than a hypothetical model configured to randomly guess that outcome would have fared.
A peek under the hood of the web browsing and geo-behavioral model revealed some interesting patterns associated with areas surrounding closed Gap stores.
Outdoor apparel and accessories. Users who lived in areas surrounding closed Gap stores were much more likely to visit retailers that specialized in outdoor gear than the national average. Brands such as Carhartt, LL Bean, Columbia, and the North Face were the most popular destinations for users in these areas.
Everyday women’s retailers. Users in areas surrounding closed Gap stores showed a strong propensity to visit stores such as Chico’s, Talbots, and Dressbarn. These stores tend to carry more conventional, modest apparel and slightly undercut Gap on price across products.
Youth Style. Users in areas surrounding closed Gap stores have a greater than average affinity for visiting stores that market themselves towards youth culture. These stores include Aeropostale, Journeys, Urban Outfitters, and Zumiez.
Bargain Shopping. Users in areas surrounding closed Gap stores were more likely to browse content online related to coupon research, big box shopping, and Black Friday deals. Conversely, they also showed low propensity to browse content online related to luxury shopping.
Predicting the Next Store Closures?
Since we began this investigation into Gap store closures, the retailer has announced that it will plan to close “hundreds of stores” based on “profits, trends, and other factors.” While we are not privy to the P&L statements of each Gap store, we can apply the patterns we observed around previously closed Gap stores to make educated guesses about the stores most at-risk of closing next. The intuition behind this forecast is simple – open Gap stores that exist in a surrounding area where users behave most similarly to users in areas where Gap has previously closed are flagged as “at-risk”. We did this by building web browsing and geo-behavioral profiles of zip codes across the country (we have developed a patented technology that does this based on mobile device location history and IP-matching), then measured how closely the profile of each zip code matched the web browsing and geo-behavioral patterns of users surrounding closed Gap stores. The following regions showed the greatest similarity to areas around closed Gap stores, based on the web browsing and geo-behavioral tendencies of the people in those regions.
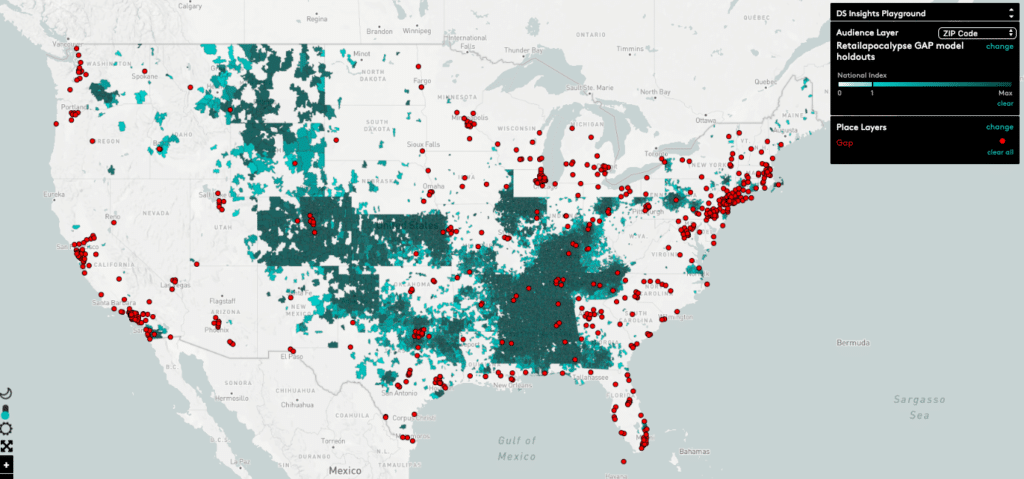
This map visualizes the areas where we predict Gap stores are most at-risk of closing. The blue-green regions indicate the zip codes in which people behave most similarly to people who live in the surrounding area of a closed Gap location. Open Gap locations are plotted on this map with red dots.
Southeast region. Of the top ten most “at-risk” regions for open Gap store closure, more than half of them were located in the Southeast United States. States such as Alabama, Kentucky, and Mississippi contain a high concentration of users who exhibit similar web browsing and location visitation patterns to users surrounding previously closed Gap stores.
Colorado. Due to the region’s strong affinity for outdoor retailers, Colorado scores high as an “at-risk” area for open Gap stores.
Central Connecticut. One of the more curious “at-risk” regions, an area adjacent to Hartford that includes three open Gap stores contains a high number of users who behave similarly to users who live around previously closed stores. This stood out to us as an anomaly in an otherwise Gap-friendly region.
Lessons for Surviving the Retail Apocalypse
This experiment sheds light on the power of web browsing and geo-behavioral signals in supplementing traditional measures like income to understand the relationship between a brand’s store location and the surrounding area. We believe this understanding can be applied to a number of important operational and marketing initiatives for any retail brand. The obvious application to extract value from these signals is to integrate them into the retail location scouting process. Having a granular understanding of the web and geo-behavioral patterns of people in areas surrounding a possible retail location can indicate whether the location is a fit and if the retailer is filling a gap (no pun intended).
However, the opportunity to incorporate these signals across brand strategy should not be overlooked. Web and geo-behavioral data can inform creative messaging, strengthening the alignment between the brand and the audience, ensuring that a 30% off coupon is directed to areas with a large population of bargain shoppers while creative displaying this season’s hottest new items are targeted to areas with high concentrations of fashionistas. A third application of this data lies in informing strategic marketing activations. Analyzing which areas surrounding retail locations also show high affinity for live events based on these web and geo-behavioral signals can help brands make smarter decisions when it comes to experiential marketing and in-store events. Ultimately, paying attention to the web browsing and geo-behavioral signals of prospective retail areas can reduce uncertainty in a brand’s search for the right location and lead to insights that guide successful marketing programs.